Understanding UK Crime Statistics: What the Numbers Actually Tell You
Crime statistics can be confusing and misleading if you don't know how to read them. Discover what UK crime data really means and how to interpret the numbers to make informed decisions about where to live.
Understanding UK Crime Statistics: What the Numbers Actually Tell You
If you've ever tried to research crime in your area, you've probably encountered a bewildering array of statistics, percentages, and crime categories that seem designed to confuse rather than inform. You're not alone—even seasoned property professionals sometimes struggle to make sense of the data.
The truth is, crime statistics can be incredibly useful for making informed decisions about where to live, work, or invest. But only if you know how to read them properly. Let me walk you through what these numbers really mean and, more importantly, what they don't.
The Source: Where UK Crime Data Comes From
Almost all publicly available crime data in the UK comes from Police.UK, which aggregates reported crimes from police forces across England, Wales, and Northern Ireland. Scotland has its own system, but the principles are similar.
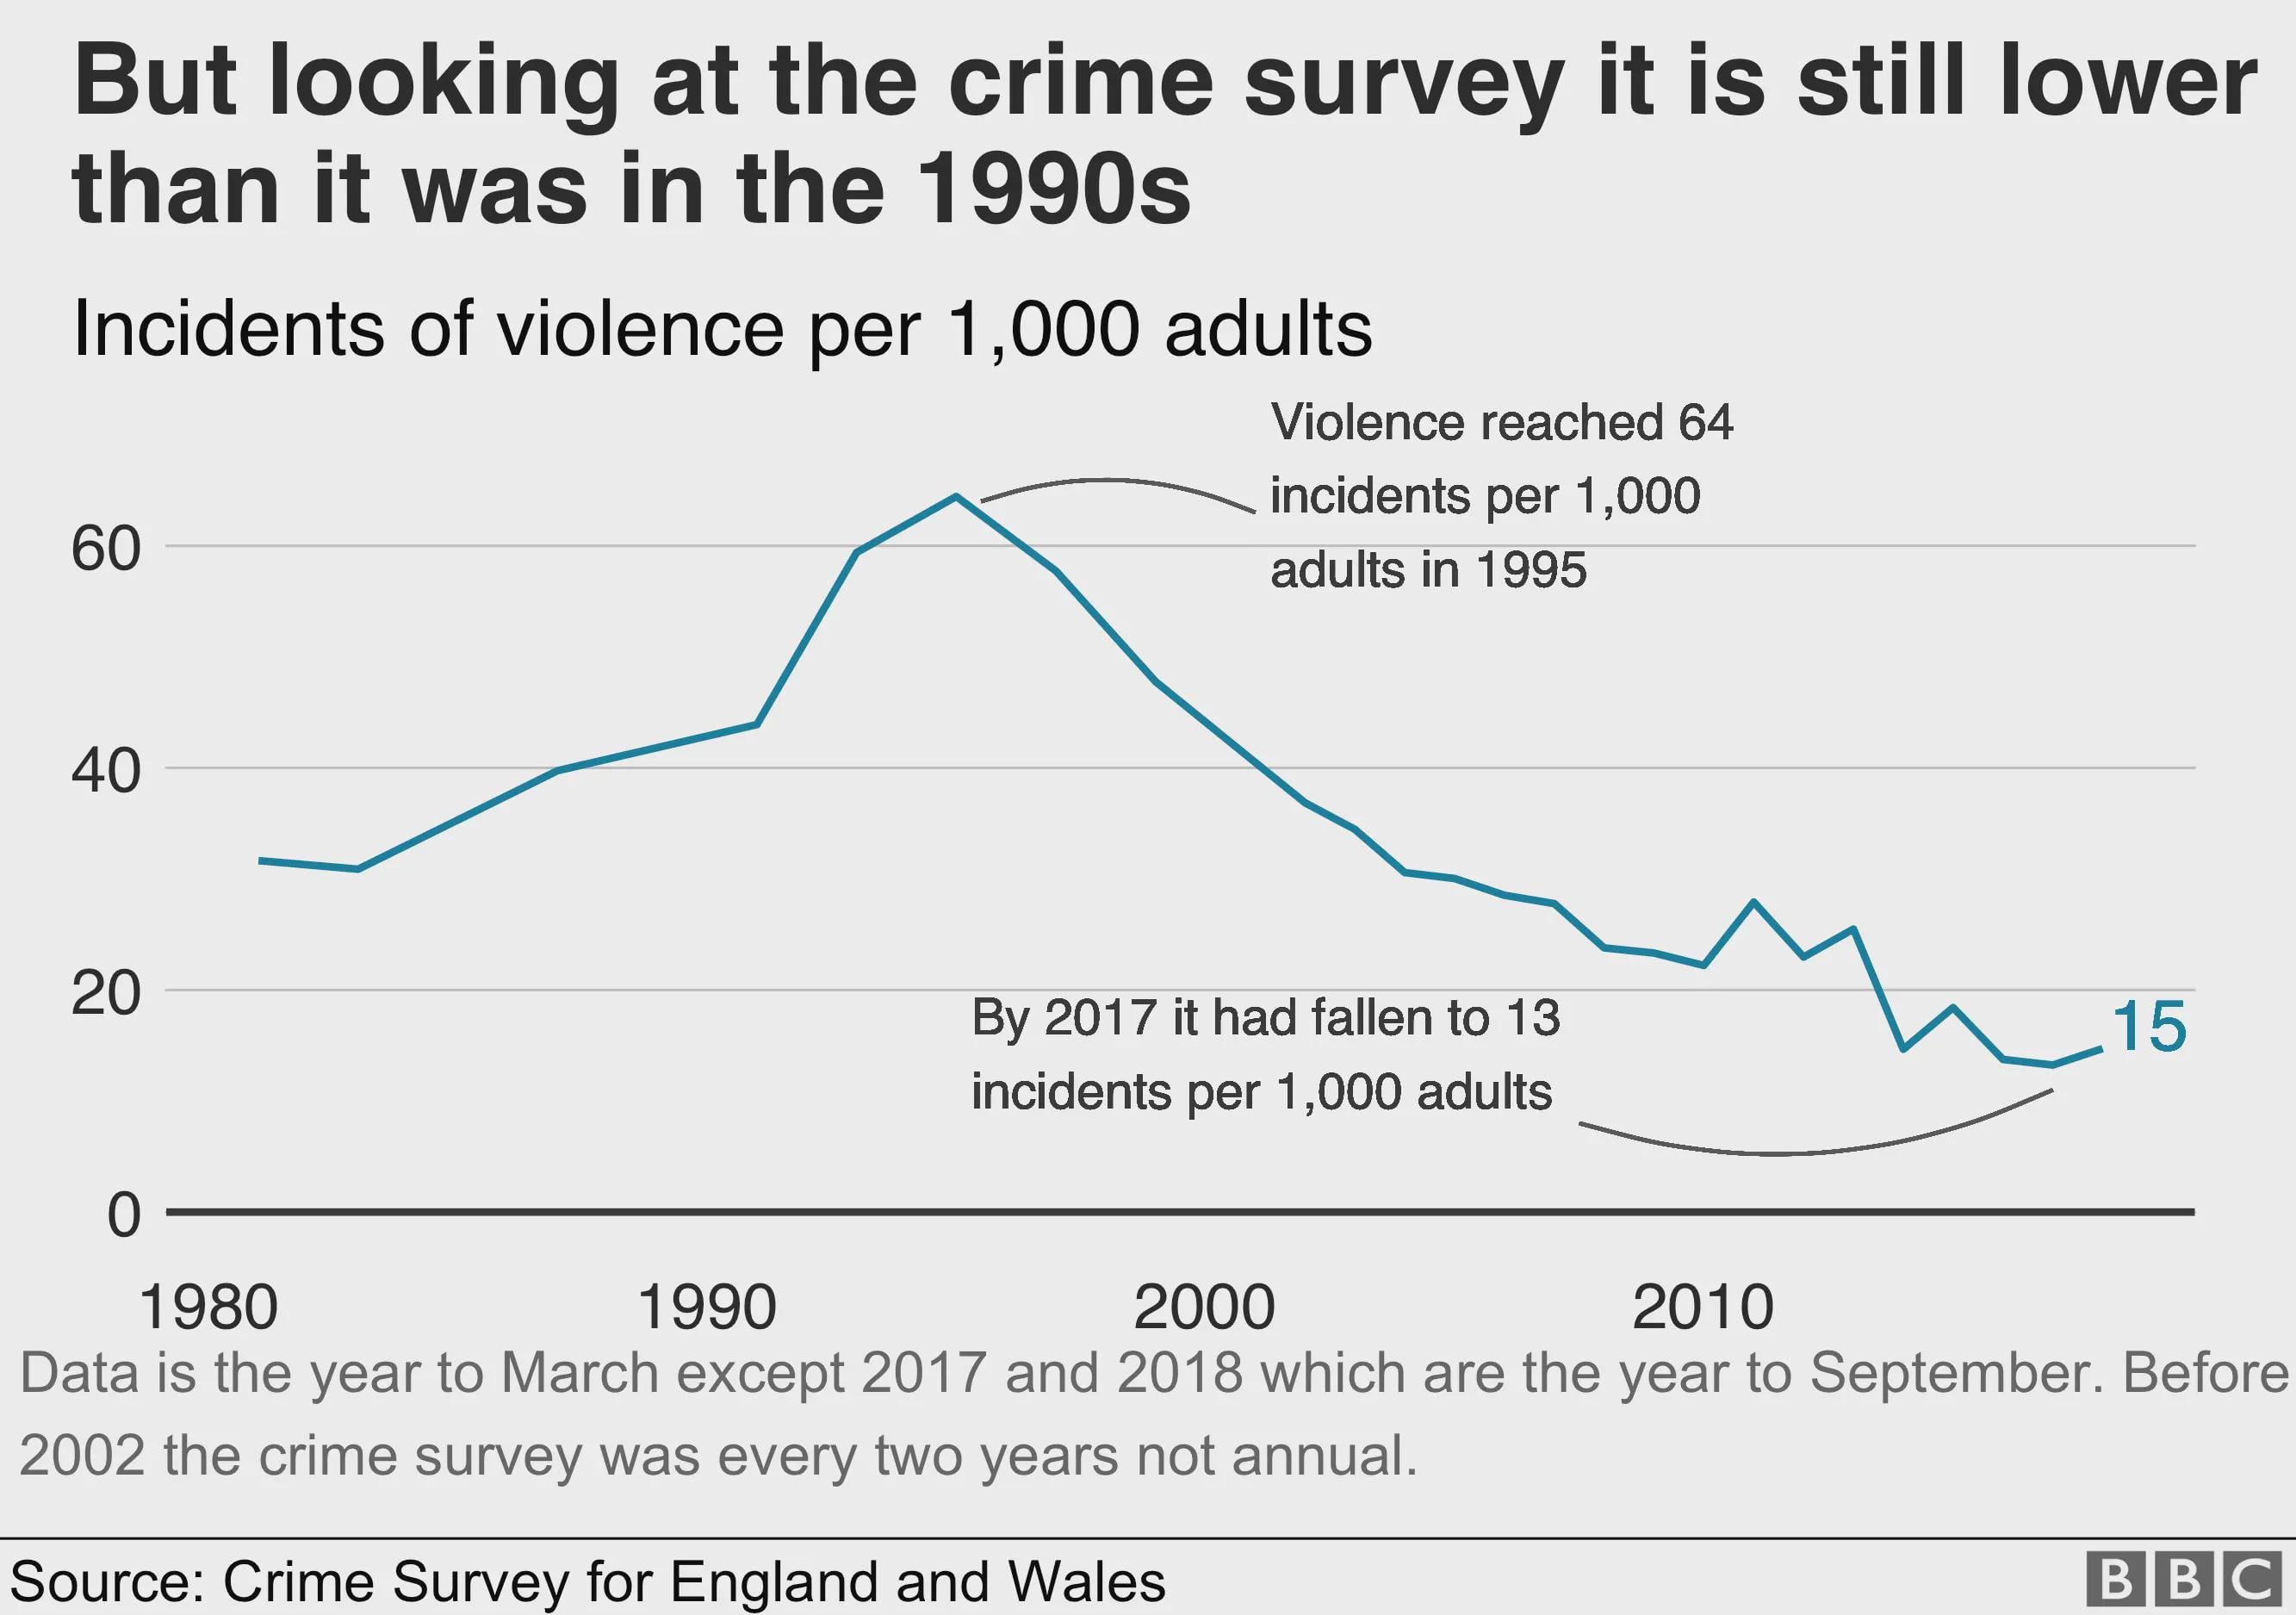
Here's the first thing you need to understand: these statistics only reflect reported crimes. If someone's bike gets stolen but they don't report it because they assume nothing will be done, it won't appear in the data. Studies suggest that as many as half of all crimes go unreported, particularly lower-level offences like theft or vandalism.
This doesn't make the statistics useless—far from it. But it does mean you're looking at a partial picture. Areas with more engaged communities and better police relationships often have higher reporting rates, which can paradoxically make them appear more dangerous than areas where residents have simply given up reporting crime.
Decoding Crime Categories: What Each One Really Means
The UK classifies crimes into several broad categories, and understanding these is crucial to interpreting the data correctly.
Anti-social behaviour is probably the most misunderstood category. It covers everything from noisy neighbours and littering to aggressive begging and public drunkenness. While these aren't "crimes" in the traditional sense, they're often the most visible indicator of neighbourhood quality. High levels of anti-social behaviour can make an area feel unsafe even if serious crime rates are relatively low.
Violence and sexual offences is a broad category that includes everything from murder (thankfully rare) to common assault and harassment. The vast majority of violent crimes occur between people who know each other—domestic disputes, pub fights, arguments between neighbours. Random street violence, while it makes headlines, is statistically uncommon in most UK areas.
Burglary is split into residential and commercial. For homeowners and renters, residential burglary is obviously the more relevant metric. This is one of the few crime categories where the statistics closely match public concern—people really do worry about their homes being broken into, and the data reflects genuine risk.
Vehicle crime includes theft of vehicles, theft from vehicles, and interference with vehicles. If you park on the street or don't have a garage, this is worth paying attention to. Some areas have persistent problems with catalytic converter theft or car break-ins that might not be immediately obvious from walking around.
Theft covers shoplifting, pickpocketing, and other theft that doesn't fit into burglary or vehicle crime. High theft rates often indicate busy commercial areas rather than dangerous residential neighbourhoods—Oxford Street in London has astronomical theft rates because of shoplifting, but that doesn't make it unsafe to live nearby.
The Numbers Game: Rates vs. Raw Totals
Here's where many people get confused. A postcode with 100 crimes sounds worse than one with 50 crimes, right? Not necessarily.
What matters is the crime rate—crimes per 1,000 residents. A busy urban postcode with 5,000 residents and 100 crimes has a rate of 20 per 1,000. A quiet rural village with 200 residents and 10 crimes has a rate of 50 per 1,000—more than twice as high, even though the absolute number of crimes is much lower.
This is why you can't just compare raw crime numbers between areas. You need to look at rates adjusted for population. Most crime mapping tools do this automatically, but it's worth understanding the principle.
Similarly, be wary of percentages without context. "Crime up 50%" sounds alarming until you learn it means an increase from 2 crimes to 3 crimes. Always look at the actual numbers behind the percentages.
Temporal Patterns: When Crime Happens Matters
Crime isn't evenly distributed throughout the year. Most areas see spikes during summer months when people are out more and homes are left empty during holidays. December often sees increased theft and burglary around Christmas shopping season.
This seasonal variation is normal and doesn't indicate a fundamental problem with an area. What you should watch for is sustained trends over multiple years. Is crime consistently increasing, decreasing, or stable? A single bad month or year could be a statistical blip; a three-year upward trend is a genuine concern.
Time of day matters too, though this information isn't always available in public data. An area with high crime rates concentrated in late-night hours around pubs and clubs is very different from one where crimes occur throughout the day in residential areas.
Geographic Precision: The Postcode Lottery
One of the most important things to understand about UK crime statistics is how dramatically they can vary over very short distances. Crime doesn't respect administrative boundaries or spread evenly across neighbourhoods.
You might find a street with virtually no crime sitting next to one with persistent problems. A single housing estate can have vastly different crime rates from the surrounding area. This is why generic area searches—"crime in Manchester" or "is Birmingham safe"—are almost useless.
Always research the specific postcode you're interested in, and even then, look at the street-level data if available. Police.UK maps show approximate locations of crimes, which can help you understand whether incidents are concentrated in particular spots or spread throughout an area.
What Statistics Can't Tell You
For all their usefulness, crime statistics have significant limitations. They can't tell you about the fear of crime, which often doesn't correlate with actual risk. They can't capture the quality of life issues that make an area pleasant or unpleasant to live in. And they can't predict future trends with certainty.
Statistics also can't tell you about your personal risk factors. A young man walking home alone at night faces different risks than a family with children or an elderly couple. Your lifestyle, habits, and circumstances all affect your actual exposure to crime in ways that aggregate statistics can't capture.
Moreover, the data is always backward-looking. You're seeing what happened over the past year, not what will happen next year. Areas can improve or deteriorate quickly, especially if there are major changes like new developments, changes in local policing, or shifts in the local economy.
Putting It All Together: Making Informed Decisions
So how do you actually use crime statistics to make decisions? Start by looking at the overall crime rate for your target area compared to similar neighbourhoods. Is it higher, lower, or about average?
Then drill down into the types of crimes. High levels of anti-social behaviour and residential burglary are bigger red flags for most people than high rates of shoplifting or vehicle crime. Look at trends over time—is the situation improving or getting worse?
Compare multiple sources if you can. Police.UK data, local news reports, community forums, and conversations with residents can all provide different perspectives. No single source tells the complete story.
Finally, visit the area yourself at different times. Statistics can guide your research, but they shouldn't replace your own observations and instincts. The safest area on paper might not feel right to you, and that matters too.
The Reality Check
Crime statistics are a tool, not a crystal ball. They provide valuable information but require interpretation and context. An area with slightly higher crime rates might still be perfect for you if it offers other advantages like affordability, good schools, or a shorter commute.
Conversely, even the safest areas aren't crime-free. Nowhere in the UK has zero crime, and trying to find a completely risk-free neighbourhood is both impossible and probably unnecessary.
The goal isn't to avoid all risk—it's to make informed decisions based on accurate information rather than assumptions, estate agent marketing, or media scare stories. Understanding what crime statistics actually tell you is the first step toward making those informed decisions.
Use the data wisely, combine it with other research methods, and remember that numbers on a screen are just one piece of the puzzle when choosing where to live.